bassin_vienne = FileAttachment("layers/bassin_vienne.geojson").json();
departement = FileAttachment("layers/departement.geojson").json();
region = FileAttachment("layers/region.geojson").json();
epci = FileAttachment("layers/epci.geojson").json();
perimetre = FileAttachment("layers/perimetre.json").json();
slgri = FileAttachment("layers/slgri.json").json();
tri = FileAttachment("layers/tri.json").json();
zone_inondable = FileAttachment("layers/zone_inondable.geojson").json();
//indicateurs = FileAttachment("layers/indicateurs.json").json();
cours_d_eau = FileAttachment("layers/cours_d_eau.geojson").json();
indicateursGeojson = FileAttachment("layers/indicateurs.geojson").json();
batiments = FileAttachment("layers/batiments_hauteur.geojson").json();
map = {
const container = html`<div class="map-container" id="map" style="height: 665px; width: 100%;"></div>`;
yield container;
<!-- const sourcePlanIGN = { -->
<!-- style: 'normal', -->
<!-- format: 'image/png', -->
<!-- layer: 'GEOGRAPHICALGRIDSYSTEMS.PLANIGNV2' -->
<!-- }; -->
const sourceOrtho = {
style: 'normal',
format: 'image/jpeg',
layer: 'HR.ORTHOIMAGERY.ORTHOPHOTOS'
};
const map = new maplibregl.Map({
container: container,
style: 'https://basemaps.cartocdn.com/gl/voyager-gl-style/style.json',
<!-- center: [-0.04, 46.3051], -->
zoom: 11
});
map.addControl(new maplibregl.FullscreenControl(), 'top-right');
map.addControl(new maplibregl.NavigationControl({ visualizePitch: true }), 'top-left');
map.addControl(new maplibregl.ScaleControl({ maxWidth: 80, unit: 'metric' }));
const toggleStyle = (useOrtho) => {
if (useOrtho) {
map.setLayoutProperty('orthoIGN', 'visibility', 'visible');
map.setLayoutProperty('OSM', 'visibility', 'none');
} else {
map.setLayoutProperty('orthoIGN', 'visibility', 'none');
map.setLayoutProperty('OSM', 'visibility', 'visible');
}
};
map.on('load', () => {
map.fitBounds(
[
[-0.04, 46.3051], // Sud-Ouest
[0.7741, 46.8565] // Nord-Est
],
{
padding: 20,
linear: true,
duration: 0
}
);
// Ajout des fonds raster IGN
<!-- map.addSource('raster-planign', { -->
<!-- type: 'raster', -->
<!-- tiles: [ -->
<!-- `https://data.geopf.fr/wmts?SERVICE=WMTS&style=${sourcePlanIGN.style}&VERSION=1.0.0&REQUEST=GetTile&format=${sourcePlanIGN.format}&layer=${sourcePlanIGN.layer}&tilematrixset=PM&TileMatrix={z}&TileCol={x}&TileRow={y}` -->
<!-- ], -->
<!-- tileSize: 256, -->
<!-- attribution: '© <a href="https://www.ign.fr/">IGN</a>', -->
<!-- minzoom: 0, -->
<!-- maxzoom: 22 -->
<!-- }); -->
map.addSource('raster-ortho', {
type: 'raster',
tiles: [
`https://data.geopf.fr/wmts?SERVICE=WMTS&style=${sourceOrtho.style}&VERSION=1.0.0&REQUEST=GetTile&format=${sourceOrtho.format}&layer=${sourceOrtho.layer}&tilematrixset=PM&TileMatrix={z}&TileCol={x}&TileRow={y}`
],
tileSize: 256,
attribution: '© <a href="https://www.ign.fr/">IGN</a>',
minzoom: 0,
maxzoom: 22
});
map.addSource('raster-osm', {
type: 'raster',
tiles: [
'https://tile.openstreetmap.org/{z}/{x}/{y}.png'
],
tileSize: 256,
attribution:
'© <a href="https://www.openstreetmap.org/copyright">OpenStreetMap</a> contributors',
minzoom: 0,
maxzoom: 19
});
<!-- map.addLayer({ -->
<!-- id: 'planIGN', -->
<!-- type: 'raster', -->
<!-- source: 'raster-planign', -->
<!-- layout: { visibility: 'visible' } -->
<!-- }); -->
map.addLayer({
id: 'orthoIGN',
type: 'raster',
source: 'raster-ortho',
layout: { visibility: 'none' }
});
map.addLayer({
id: 'OSM',
type: 'raster',
source: 'raster-osm',
layout: { visibility: 'visible' } // tu peux le laisser caché au départ si tu veux le basculer ensuite
});
//fetch('layers/indicateurs.geojson')
//.then(response => response.json())
//.then(indicateursGeojson => {
const layersData = [
{ data: bassin_vienne, type: 'line', id: 'bassinvienneLayer', color: 'green', layout: {visibility:'none'}},
{ data: region, type: 'line', id: 'regionLayer', color: 'red', layout: {visibility:'none'} },
{ data: departement, type: 'line', id: 'departementLayer', color: '#a772b9', width: 2, layout:{visibility:'none'}},
{ data: epci, type: 'line', id: 'epciLayer', color: '#567ae3', layout: {visibility:'none'} },
{ data: indicateursGeojson, // GeoJSON contenant une propriété 's12a' -->
type: 'fill',
id: 'indicateurs12aLayer',
opacity: 0.9,
width: 1,
dynamicColor: {
property: 's12a',
mapping: {
//'-1': '#f1eeed',
//'0': '#ffffff',
'10': '#ffffff',
'50': '#ffaaaa',
'100': '#ff5555'
},
default: '#d9d9d9'
}
, layout: {visibility:'visible'}
},
{ data: zone_inondable, type: 'fill', id: 'zoneinondableLayer', color: '#b4c3ef' , width: 2, opacity: 1,
layout: {visibility:'visible'} },
{ data: cours_d_eau, type: 'line', id: 'coursdeauLayer', color: '#b4c3ef' , width: 2, opacity: 1,
layout: {visibility:'visible'} },
{ data: batiments, type: 'fill-extrusion', id: 'batimentsLayer', width:2, opacity: 1, colorByType: 'ff_dteloctxt', heightProperty: 'hauteur',layout: {visibility:'none'}}
];
// Créer le conteneur
const legend = document.createElement('div');
legend.id = 'legend';
legend.style.position = 'absolute';
legend.style.top = '82%';
legend.style.right = '10px';
legend.style.transform = 'translateY(-50%)';
legend.style.background = 'white';
legend.style.padding = '10px';
legend.style.fontSize = '12px';
legend.style.borderRadius = '4px';
legend.style.boxShadow = '0 1px 4px rgba(0,0,0,0.3)';
legend.style.zIndex = '1'; // pour passer au-dessus de la carte
// Contenu de la légende
legend.innerHTML = `
<strong>Population en zone <br>fortement inondable</strong><br>
<div><span style="background:#d9d9d9;width:12px;height:12px;display:inline-block;margin-right:5px;"></span> 0</div>
<div><span style="background:#ffffff;width:12px;height:12px;display:inline-block;margin-right:5px;border:1px solid #ccc;"></span> < 10 </div>
<div><span style="background:#ffaaaa;width:12px;height:12px;display:inline-block;margin-right:5px;"></span> 10-50 </div>
<div><span style="background:#ff5555;width:12px;height:12px;display:inline-block;margin-right:5px;"></span> 50-100 </div>
<div><span style="background:#ff0000;width:12px;height:12px;display:inline-block;margin-right:5px;"></span> > 100 </div>
`;
// L’ajouter à la carte (le container MapLibre)
map.getContainer().appendChild(legend);
//afin de lier la légende à l'indicateur
function updateLegendVisibility() {
const visibility = map.getLayoutProperty('indicateurs12aLayer', 'visibility');
if (visibility === 'none') {
legend.style.display = 'none';
} else {
legend.style.display = 'block';
}
}
map.on('idle', updateLegendVisibility);
// Créer le conteneur de légende des bâtiments
const batimentLegend = document.createElement('div');
batimentLegend.id = 'batiment-legend';
batimentLegend.style.position = 'absolute';
batimentLegend.style.top = '81%';
batimentLegend.style.left = '10px';
batimentLegend.style.transform = 'translateY(-50%)';
batimentLegend.style.background = 'white';
batimentLegend.style.padding = '10px';
batimentLegend.style.fontSize = '12px';
batimentLegend.style.borderRadius = '4px';
batimentLegend.style.boxShadow = '0 1px 4px rgba(0,0,0,0.3)';
batimentLegend.style.zIndex = '1';
// Contenu de la légende
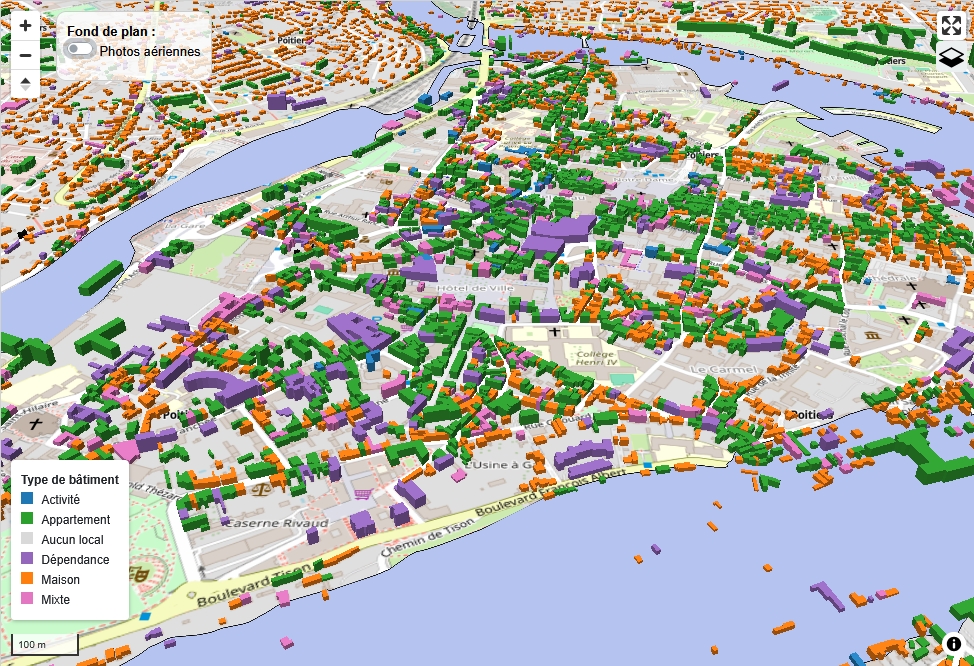
batimentLegend.innerHTML = `
<strong>Type de bâtiment</strong><br>
<div><span style="background:#1f77b4;width:12px;height:12px;display:inline-block;margin-right:5px;"></span> Activité</div>
<div><span style="background:#2ca02c;width:12px;height:12px;display:inline-block;margin-right:5px;"></span> Appartement</div>
<div><span style="background:#d9d9d9;width:12px;height:12px;display:inline-block;margin-right:5px;"></span> Aucun local</div>
<div><span style="background:#9467bd;width:12px;height:12px;display:inline-block;margin-right:5px;"></span> Dépendance</div>
<div><span style="background:#ff7f0e;width:12px;height:12px;display:inline-block;margin-right:5px;"></span> Maison</div>
<div><span style="background:#e377c2;width:12px;height:12px;display:inline-block;margin-right:5px;"></span> Mixte</div>
`;
// L’ajouter à la carte
map.getContainer().appendChild(batimentLegend);
batimentLegend.style.display = 'none'; // Permet de supprimer l'affichage de la légende au chargement de la page
// Lier la visibilité à la couche bâtiment
function updateBatimentLegendVisibility() {
const visibility = map.getLayoutProperty('batimentsLayer', 'visibility');
//batimentLegend.style.display = (visibility === 'none') ? 'none' : 'block';
if (visibility === 'none') {
batimentLegend.style.display = 'none';
} else {
batimentLegend.style.display = 'block';
}
}
map.on('idle', updateBatimentLegendVisibility);
// Ajout des couches vectorielles
layersData.forEach(layer => {
map.addSource(layer.id, {
type: 'geojson',
data: layer.data
});
const layerConfig = {
id: layer.id,
type: layer.type,
source: layer.id,
paint: {},
layout: layer.layout
};
if (layer.type === 'fill') {
if (layer.dynamicColor) {
const prop = ['get', layer.dynamicColor.property];
layerConfig.paint['fill-color'] = [
'case',
['!', ['has', layer.dynamicColor.property]], '#d9d9d9', // Propriété absente
['any', ['==', ['get', layer.dynamicColor.property], null], ['==', ['get', layer.dynamicColor.property], 0]], '#d9d9d9', // null ou 0
['<', ['get', layer.dynamicColor.property], 10], '#ffffff',
['<', ['get', layer.dynamicColor.property], 50], '#ffaaaa',
['<', ['get', layer.dynamicColor.property], 100], '#ff5555',
['>=', ['get', layer.dynamicColor.property], 100], '#ff0000',
'#d9d9d9' // fallback
];
} else {
layerConfig.paint['fill-color'] = layer.color || '#000000';
}
layerConfig.paint['fill-opacity'] = layer.opacity || 0.4;
layerConfig.paint['fill-outline-color'] = '#000000';
} else if (layer.type === 'line') {
layerConfig.paint['line-color'] = layer.color || '#000000';
layerConfig.paint['line-width'] = layer.width || 1;
} else if (layer.type === 'fill-extrusion') {
if (layer.colorByType === 'ff_dteloctxt') {
layerConfig.paint['fill-extrusion-color'] = [
'match',
['get', 'ff_dteloctxt'],
'ACTIVITE', '#1f77b4',
'APPARTEMENT', '#2ca02c',
'AUCUN LOCAL', '#d9d9d9',
'DEPENDANCE', '#9467bd',
'MAISON', '#ff7f0e',
'MIXTE', '#e377c2',
'#000000' // fallback
];
} else {
layerConfig.paint['fill-extrusion-color'] = layer.color || '#000000';
}
layerConfig.paint['fill-extrusion-height'] = ['get', layer.heightProperty || 'hauteur'];
layerConfig.paint['fill-extrusion-base'] = 0;
layerConfig.paint['fill-extrusion-opacity'] = layer.opacity || 0.9;
}
map.addLayer(layerConfig);
map.addLayer({
id: 'indicateurs12aLabels',
type: 'symbol',
source: 'indicateurs12aLayer', // le même id que ta source GeoJSON
layout: {
'text-field': ['get', 'nom'],
'text-size': 11,
'text-font': ['Open Sans Bold', 'Arial Unicode MS Bold'],
'text-offset': [0, 0.6],
'text-anchor': 'top'
},
paint: {
'text-color': '#000000',
'text-halo-color': '#ffffff',
'text-halo-width': 1
}
});
map.addLayer({
id: 'indicateurs12a-hover',
type: 'line',
source: 'indicateurs12aLayer', // même source
paint: {
'line-color': '#000',
'line-width': 2
},
filter: ['==', 'nom', ''] // vide au début
});
map.on('click', 'indicateurs12aLayer', (e) => {
const feature = e.features[0];
const image= feature.properties.image;
const nom = feature.properties.nom || 'Non disponible';
const population = feature.properties.population
? feature.properties.population.toLocaleString('fr-FR') + ' habitants'
: 'Non disponible';
const s12aValue = feature.properties.s12a || '0';
const dommages = (Number(s12aValue) || 0).toLocaleString('fr-FR');
const batimentsValue = feature.properties.nb_batiments;
const batiments = !isNaN(parseFloat(batimentsValue))
? parseInt(batimentsValue).toLocaleString('fr-FR')
: 'Non disponible';
const batindif = feature.properties.nb_bat_indif?.toLocaleString('fr-FR');
const batsportifValue = parseFloat(feature.properties.nb_bat_sportif);
const batsportif = (!isNaN(batsportifValue) ? batsportifValue : 0).toLocaleString('fr-FR');
const batagricolefValue = parseFloat(feature.properties.nb_bat_agricole);
const batagricole = (!isNaN(batagricolefValue) ? batagricolefValue : 0).toLocaleString('fr-FR');
const batresidentielValue = parseFloat(feature.properties.nb_bat_residentiel);
const batresidentiel = (!isNaN(batresidentielValue) ? batresidentielValue : 0).toLocaleString('fr-FR');
const batannexeValue = parseFloat(feature.properties.nb_bat_annexe);
const batannexe = (!isNaN(batannexeValue) ? batannexeValue : 0).toLocaleString('fr-FR');
const batreligieuxValue = parseFloat(feature.properties.nb_bat_religieux);
const batreligieux = (!isNaN(batreligieuxValue) ? batreligieuxValue : 0).toLocaleString('fr-FR');
const batindustrielValue = parseFloat(feature.properties.nb_bat_industriel);
const batindustriel = (!isNaN(batindustrielValue) ? batindustrielValue : 0).toLocaleString('fr-FR');
const batcommercialValue = parseFloat(feature.properties.nb_bat_commercial);
const batcommercial = (!isNaN(batcommercialValue) ? batcommercialValue : 0).toLocaleString('fr-FR');
const popupContent = `
<style>
.maplibregl-popup-content {
padding: 4px !important;
border: 1px solid;
border-radius: 8px;
width: 270px;
box-shadow: rgba(101, 147, 220, 0.2) 0px 4px 8px 0px;
border-color: rgba(101, 147, 220, 0.5);
}
</style>
<div style="font-family: sans-serif; font-size: 13px; margin:10px;">
<div style="background-color: #d1ee9c; border: 1px solid; border-radius:8px; margin-bottom:16px; padding:10px;"><strong>
<center>${nom}</center>
</strong></div>
<p style="text-align:center !important"><strong>- Population :</strong> ${population}</p>
<p style="text-align:center !important"><strong>- Nombre de personnes en zone fortement inondable :</strong> ${dommages}</p>
`;
new maplibregl.Popup({closeButton: false})
.setLngLat(e.lngLat)
.setHTML(popupContent)
.addTo(map);
// Mettre à jour le conteneur HTML avec les informations spécifiques du marqueur
document.getElementById('donnees').innerHTML = `
<div style="text-align:center; font-family:sans-serif; font-size:16px;">
<img src="${image}" style="width:300px; margin-bottom:10px;"><br>
<strong style="font-size:1.1em;"><i class="bi bi-geo-alt-fill"></i> Commune :</strong> ${nom}<br>
<strong style="font-size:1.1em;"><i class="bi bi-people-fill"></i> Nombre d'habitants :</strong> ${population}<br>
<strong style="font-size:1.1em;"><i class="bi bi-house-fill"></i> Nombre de bâtiments :</strong> ${batiments}<br>
<div style="margin-top:10px;"><strong>Dont :</strong></div>
<ul style="list-style:none; padding:0;">
<li><h5 style="font-size:1em;">${batindif} <strong>bâtiments indifférenciés</strong></h5></li>
<li><h5 style="font-size:1em;">${batsportif} <strong>bâtiments sportifs</strong></h5></li>
<li><h5 style="font-size:1em;">${batagricole} <strong>bâtiments agricoles</strong></h5></li>
<li><h5 style="font-size:1em;">${batresidentiel} <strong>bâtiments résidentiels</strong></h5></li>
<li><h5 style="font-size:1em;">${batannexe} <strong>bâtiments annexes</strong></h5></li>
<li><h5 style="font-size:1em;">${batreligieux} <strong>bâtiments religieux</strong></h5></li>
<li><h5 style="font-size:1em;">${batindustriel} <strong>bâtiments industriels</strong></h5></li>
<li><h5 style="font-size:1em;">${batcommercial} <strong>bâtiments commerciaux</strong></h5></li>
</ul>
<div style="margin-top:10px;">
<strong style="font-size:1.1em;"><i class="bi bi-droplet-half"></i> Nombre de personnes en zone fortement inondable :</strong> ${dommages}
</div>
</div>
`;
});
map.on('mousemove', 'indicateurs12aLayer', (e) => {
if (e.features.length > 0) {
const nomCommune = e.features[0].properties.nom;
map.setFilter('indicateurs12a-hover', ['==', 'nom', nomCommune]);
map.getCanvas().style.cursor = 'pointer';
}
});
map.on('mouseleave', 'indicateurs12aLayer', () => {
map.setFilter('indicateurs12a-hover', ['==', 'nom', '']);
map.getCanvas().style.cursor = '';
});
});
// Interface de contrôle des couches
const mapLayersDiv = document.createElement('div');
mapLayersDiv.classList.add('mapLayers');
mapLayersDiv.style.position = 'absolute';
mapLayersDiv.style.zIndex = '1000';
mapLayersDiv.innerHTML = `
<button id="toggleMapMenuButton" class="btn btn-light aria-label="Afficher les couches" title="Afficher les couches">
<img src="Images/icons/layers-half.svg" alt="Icône SVG" width="25" height="25">
</button>
<div id="layersList" style="display: none; background: white; padding: 10px; border: 1px solid #ccc;"></div>
`;
map.getContainer().appendChild(mapLayersDiv);
const toggleableLayerIds = layersData.map(layer => layer.id);
const aliasLayerIds = {
bassinvienneLayer: 'Bassin de la Vienne',
regionLayer: 'Région',
departementLayer: 'Département',
epciLayer: 'EPCI',
zoneinondableLayer: 'Zonage Inondable',
coursdeauLayer: "Cours d'eau",
indicateurs12aLayer: 'Bâtiments de plain-pied',
batimentsLayer: "Bâtiments"
};
function toggleLayerVisibility(id, visible) {
const visibility = visible ? 'visible' : 'none';
if (map.getLayer(id)) {
map.setLayoutProperty(id, 'visibility', visibility);
}
}
const layersListDiv = mapLayersDiv.querySelector('#layersList');
toggleableLayerIds.forEach(id => {
const name = aliasLayerIds[id] || id;
const checkbox = document.createElement('input');
checkbox.type = 'checkbox';
checkbox.id = id;
checkbox.className = 'form-check-input';
// ✅ Lire la visibilité actuelle directement dans la carte
map.once('idle', () => {
const visibility = map.getLayoutProperty(id, 'visibility');
checkbox.checked = visibility === 'visible';
});
checkbox.addEventListener('change', () => toggleLayerVisibility(id, checkbox.checked));
const label = document.createElement('label');
label.htmlFor = id;
label.className = 'form-check-label';
label.innerText = name;
const wrapper = document.createElement('div');
wrapper.className = 'form-check';
wrapper.appendChild(checkbox);
wrapper.appendChild(label);
layersListDiv.appendChild(wrapper);
});
document.getElementById('toggleMapMenuButton').addEventListener('click', () => {
layersListDiv.style.display = layersListDiv.style.display === 'none' ? 'block' : 'none';
});
// Menu bascule fond de plan
const mapMenuDiv = document.createElement('div');
mapMenuDiv.classList.add('mapFondDePlan');
mapMenuDiv.style.position = 'absolute';
mapMenuDiv.style.zIndex = '1000';
mapMenuDiv.innerHTML = `
<strong>Fond de plan :</strong>
<div class="form-check form-switch">
<input class="form-check-input" type="checkbox" role="switch" id="orthoCheckbox">
<label class="form-check-label" for="orthoCheckbox">Photos aériennes</label>
</div>
`;
map.getContainer().appendChild(mapMenuDiv);
document.getElementById('orthoCheckbox').addEventListener('change', function (e) {
e.preventDefault();
e.stopPropagation();
toggleStyle(this.checked);
});
});
};import { Plot } from "@observablehq/plot";
import { Inputs } from "@observablehq/inputs";
// Charger les données depuis le fichier généré par R
data = FileAttachment("layers/data_s12a.json").json()
html`<label for="slider-s12a" style="display: block;
margin-top: 1em;
font-weight: bold;
margin-bottom: 1em;
border: 1px solid rgba(0, 0, 0, 0.6);
box-shadow: 0px 0px 8px 0px rgba(0, 0, 0, 0.8);
border-radius: 8px;
padding: 5px;
text-align: center;
margin-right: 20%;
margin-left: 20%;">
Population en zone inondable
</label>`viewof slider = Inputs.range(
[0, 230],
{ value: 230, step: 10,
id: "slider-s12a"
}
)
html`<div style="margin-top: 30px;"></div>`sorted = data
.filter(d => d.s12a <= slider)
.sort((a, b) => a.s12a - b.s12a);
Plot.plot({
marks: [
Plot.barY(sorted, { x: "nom", y: "s12a",
fill: d => {
const val = d.s12a;
if (val === 0) return "#d9d9d9"; // null ou 0
if (val < 10) return "#f9e9e9";
if (val < 50) return "#ffaaaa";
if (val < 100) return "#ff5555";
if (val >= 100) return "#ff0000";
return "#b30000";
}
}),
Plot.text(sorted, { x: "nom", y: "s12a", text: d => `${d.s12a}`, dy: -10 })
],
y: { grid: true, label: "Population en zone fortement inondable" },
x: { label: "Commune",
tickRotate: -45,
labelAnchor: "right",
labelOffset: 30},
width: window.innerWidth * 0.95,
height: window.innerHeight * 0.85,
height: 600,
style: {
fontSize: "10px",
fill: "black",
fontWeight: "bold"
},
marginBottom: 130
})md`
<table style="width:90%; border-collapse: collapse; border:1px solid; text-align:center; margin:auto;">
<colgroup>
<col style="width:20%;">
<col style="width:20%;">
<col style="width:20%;">
<col style="width:20%;">
<col style="width:20%;">
</colgroup>
<tr>
<th style="background-color:bisque; border:1px solid;" colspan="2">Numéro d'indicateur</th>
<th style="border:1px solid;">Ind1/2a</th>
<th style="background-color:bisque; border:1px solid;">Date de mise à jour</th>
<th style="border:1px solid;">31/05/2025</th>
</tr>
<tr>
<td colspan="2" style="background-color:bisque; border:1px solid; font-weight: bold;">Intitulé</td>
<td colspan="3" style="border:1px solid;">Nombre de personnes occupant des bâtiments (logements et activités) de plain-pied
fortement inondables (plus de 1,5 m d’eau)</td>
</tr>
<tr>
<td colspan="2" style="background-color:bisque; border:1px solid; font-weight: bold;">Objectif de la SNGRI</td>
<td colspan="3" style="border:1px solid;">Objectif n°1 : Augmenter la sécurité des populations exposées</td>
</tr>
<tr>
<td colspan="2" style="background-color:bisque; border:1px solid; font-weight: bold;">Axe de vulnérabilité</td>
<td colspan="3" style="border:1px solid;">Axe 1/1 La mise en danger des personnes au sein des bâtiments</td>
</tr>
<tr>
<td colspan="2" style="background-color:bisque; border:1px solid; font-weight: bold;">Source de vulnérabilité</td>
<td colspan="3" style="border:1px solid;">S1/2 Inondation de bâtiments et risque de rupture des ouvrants dans les zones pouvant
comporter une hauteur d’eau importante</td>
</tr>
</table>
<br>
<table style="width:90%; border-collapse: collapse; border:1px solid; text-align:center; margin:auto;">
<colgroup>
<col style="width:20%;">
<col style="width:20%;">
<col style="width:20%;">
<col style="width:20%;">
<col style="width:20%;">
</colgroup>
<tr>
<td colspan="2" style="background-color:bisque; border:1px solid; font-weight: bold;">Modalités du calcul</td>
<td colspan="3" style="border:1px solid;">On sélectionne les bâtiments (habitation ou activité) de plain-pied qui intersectent la
zone d’aléa supérieure à 1,5 m et on comptabilise le nombre de personnes (habitants ou employés). Le résultat est ensuite
agrégé à la commune.</td>
</tr>
<tr>
<td colspan="2" style="background-color:bisque; border:1px solid; font-weight: bold;">Échelle de représentation</td>
<td colspan="3" style="border:1px solid;">Communale</td>
</tr>
<tr>
<td colspan="2" style="background-color:bisque; border:1px solid; font-weight: bold;">Points de vigilance</td>
<td colspan="3" style="border:1px solid;">Pour les effectifs des employés, les valeurs renseignées dans SIREN sont des fourchettes de valeurs hautes et basses. Ici, le choix de prendre la valeur haute a été retenu pour éviter de minimiser le total.
Lors de l’affectation des personnes au bâtiment, pour des carreaux à faible densité de personnes, des valeurs décimales ont pu être attribuées aux bâtiments.</td>
</tr>
<tr>
<td colspan="2" style="background-color:bisque; border:1px solid; font-weight: bold;">Table cible</td>
<td colspan="3" style="border:1px solid;">p_obj1_securite_personnes. s12a_pop_plainpied_zi_fort</td>
</tr>
<tr>
<tr>
<td colspan="2" style="background-color:bisque; border:1px solid; font-weight: bold;">Variables mobilisées</td>
<td colspan="3" style="border:1px solid;">Zd : hauteur d’eau > 1.5m,
Pop1 : habitants,
Pop2 : employés</td>
</tr>
<tr>
<tr>
<td colspan="2" style="background-color:bisque; border:1px solid; font-weight: bold;">Indicateur commun SLGRI Vienne/Clain</td>
<td colspan="3" style="border:1px solid;">non</td>
</tr>
<tr>
</table>
<br>
<table style="width:90%; border-collapse: collapse; border:1px solid; text-align:center; margin:auto;">
<colgroup>
<col style="width:10%;">
<col style="width:10%;">
<col style="width:10%;">
<col style="width:10%;">
<col style="width:10%;">
<col style="width:10%;">
<col style="width:10%;">
<col style="width:10%;">
<col style="width:10%;">
<col style="width:10%;">
</colgroup>
<tr>
<td colspan="10" style="background-color:bisque; border:1px solid; font-weight: bold;">Données sources</td>
</tr>
<tr>
<th style="background-color:bisque; border:1px solid;" colspan="2">Désignation</th>
<th style="background-color:bisque; border:1px solid;">Millésime</th>
<th style="background-color:bisque; border:1px solid;">Nationale/locale</th>
<th style="background-color:bisque; border:1px solid;">Format</th>
<th style="background-color:bisque; border:1px solid;">Type</th>
<th style="background-color:bisque; border:1px solid;" colspan="2">Producteur</th>
<th style="background-color:bisque; border:1px solid;" colspan="2">Nom fichier</th>
</tr>
<tr>
<td colspan="2" style="border:1px solid;">Hauteur d’eau >1.5m</td>
<td style="border:1px solid;">2019</td>
<td style="border:1px solid;">Locale</td>
<td style="border:1px solid;">Shape</td>
<td style="border:1px solid;">Polygone</td>
<td colspan="2" style="border:1px solid;">Cerema</td>
<td colspan="2" style="border:1px solid;">zd_sup_1m50.shp</td>
</tr>
<tr>
<td colspan="2" style="border:1px solid;">Bâtiment BDTOPO</td>
<td style="border:1px solid;">2020</td>
<td style="border:1px solid;">Nationale</td>
<td style="border:1px solid;">Shape</td>
<td style="border:1px solid;">Polygone</td>
<td colspan="2" style="border:1px solid;">IGN</td>
<td colspan="2" style="border:1px solid;">Batiment.shp</td>
</tr>
<tr>
<td colspan="2" style="border:1px solid;">Population carreau 200m INSEE</td>
<td style="border:1px solid;">2015</td>
<td style="border:1px solid;">Nationale</td>
<td style="border:1px solid;">Shape</td>
<td style="border:1px solid;">Polygone</td>
<td colspan="2" style="border:1px solid;">INSEE</td>
<td colspan="2" style="border:1px solid;">filosofi2015_carreaux_200m.shp</td>
</tr>
<tr>
<td colspan="2" style="border:1px solid;">Effectif des entreprises</td>
<td style="border:1px solid;">2021</td>
<td style="border:1px solid;">Nationale</td>
<td style="border:1px solid;">Shape</td>
<td style="border:1px solid;">Point</td>
<td colspan="2" style="border:1px solid;">INSEE</td>
<td colspan="2" style="border:1px solid;">geo_siret.shp</td>
</tr>
<tr>
<td colspan="2" style="border:1px solid;">Communes</td>
<td style="border:1px solid;">2020</td>
<td style="border:1px solid;">Nationale</td>
<td style="border:1px solid;">Shape</td>
<td style="border:1px solid;">Polygone</td>
<td colspan="2" style="border:1px solid;">Cerema</td>
<td colspan="2" style="border:1px solid;">Commune.shp</td>
</tr>
</table>
` Incliner et faire tourner la carte
Maintenez enfoncé le bouton droit de la souris sur ce symbole  et déplacez le pour incliner le point de vue ou faire tourner la carte.
Zoomer sur la carte
Zoomer sur la carte (molette de la souris) pour visualiser les bâtiments.
Une illustration pour bien comprendre la carte interactive